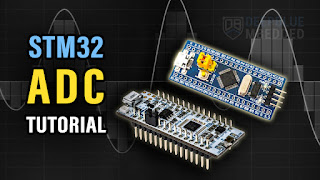
Lighting and debugging of dual-core microcontroller
Lighting and debugging a dual-core microcontroller involves setting up the development environment, configuring the cores, and using appropriate tools to monitor and debug the system. Below is a step-by-step guide to help you with this process:
1. Understand the Dual-Core Architecture
Core Types: Determine if the dual-core microcontroller uses homogeneous cores (e.g., two identical ARM Cortex-M4 cores) or heterogeneous cores (e.g., ARM Cortex-M4 + Cortex-M0+).
Memory Map: Understand the shared and core-specific memory regions.
Inter-Core Communication: Learn how the cores communicate (e.g., shared memory, mailboxes, interrupts).
2. Set Up the Development Environment
IDE: Use an Integrated Development Environment (IDE) that supports dual-core debugging (e.g., STM32CubeIDE, Keil MDK, IAR Embedded Workbench).
Toolchain: Install the appropriate compiler and debugger (e.g., GCC, ARM Compiler).
Debug Probe: Use a compatible debug probe (e.g., ST-Link, J-Link).
3. Configure the Dual-Core System
Core Initialization: Write startup code to initialize both cores.
Memory Allocation: Assign memory regions for each core (e.g., stack, heap, shared memory).
Inter-Core Communication: Implement communication mechanisms (e.g., shared variables, mailboxes, or interrupts).
4. Implement Lighting Control
Hardware Setup: Connect LEDs or other lighting components to the microcontroller GPIO pins.
Software Control:
Write code to control the LEDs (e.g., turn on/off, blink, PWM for brightness control).
Use timers or interrupts for precise timing.
5. Debugging the Dual-Core System
Core-Specific Debugging:
Use the IDE to debug each core independently.
Set breakpoints, inspect registers, and monitor variables for each core.
Inter-Core Synchronization:
Use semaphores or mutexes to avoid race conditions in shared resources.
Monitor shared memory and communication channels for consistency.
Real-Time Debugging:
Use real-time trace (if supported) to monitor core activity without stopping execution.
Use printf debugging or logging to track program flow.
6. Example: Dual-Core LED Blinking
Here’s an example of a dual-core microcontroller (e.g., STM32H7) controlling LEDs:
Core 1 (Main Core)
#include "stm32h7xx_hal.h"

void Core1_Main(void) {
    HAL_Init();
    SystemCoreClockUpdate();

    // Configure GPIO for LED
    __HAL_RCC_GPIOA_CLK_ENABLE();
    GPIO_InitTypeDef GPIO_InitStruct = {0};
    GPIO_InitStruct.Pin = GPIO_PIN_5;
    GPIO_InitStruct.Mode = GPIO_MODE_OUTPUT_PP;
    GPIO_InitStruct.Pull = GPIO_NOPULL;
    GPIO_InitStruct.Speed = GPIO_SPEED_FREQ_LOW;
    HAL_GPIO_Init(GPIOA, &GPIO_InitStruct);

    while (1) {
        HAL_GPIO_TogglePin(GPIOA, GPIO_PIN_5); // Toggle LED
        HAL_Delay(500); // Delay 500ms
    }
}
Core 2 (Secondary Core)
#include "stm32h7xx_hal.h"

void Core2_Main(void) {
    HAL_Init();
    SystemCoreClockUpdate();

    // Configure GPIO for LED
    __HAL_RCC_GPIOB_CLK_ENABLE();
    GPIO_InitTypeDef GPIO_InitStruct = {0};
    GPIO_InitStruct.Pin = GPIO_PIN_0;
    GPIO_InitStruct.Mode = GPIO_MODE_OUTPUT_PP;
    GPIO_InitStruct.Pull = GPIO_NOPULL;
    GPIO_InitStruct.Speed = GPIO_SPEED_FREQ_LOW;
    HAL_GPIO_Init(GPIOB, &GPIO_InitStruct);

    while (1) {
        HAL_GPIO_TogglePin(GPIOB, GPIO_PIN_0); // Toggle LED
        HAL_Delay(250); // Delay 250ms
    }
}
Startup Code
void StartCore2(void) {
    // Initialize Core 2
    Core2_Main();
}

int main(void) {
    // Start Core 2
    StartCore2();

    // Run Core 1
    Core1_Main();
}
7. Debugging with STM32CubeIDE
Set Up Debug Configuration:
Create a debug configuration for the dual-core microcontroller.
Ensure both cores are enabled for debugging.
Run and Debug:
Start debugging and monitor both cores simultaneously.
Use the "Core" view to switch between cores.
Breakpoints and Watchpoints:
Set breakpoints in both cores to pause execution and inspect variables.
Real-Time Trace:
Use SWO or ETM (if supported) for real-time tracing.
8. Common Debugging Techniques
Race Conditions: Use synchronization primitives (e.g., semaphores, mutexes) to avoid conflicts in shared resources.
Deadlocks: Monitor inter-core communication for potential deadlocks.
Performance Bottlenecks: Use profiling tools to identify and optimize slow code sections.
9. Tools and Resources
IDEs:
STM32CubeIDE (for STM32 microcontrollers)
Keil MDK
IAR Embedded Workbench
Debug Probes:
ST-Link
J-Link
Documentation:
Microcontroller reference manual
Dual-core programming guides
10. Troubleshooting Tips
Core Not Starting: Verify the startup code and clock configuration for both cores.
LED Not Lighting: Check GPIO configuration and hardware connections.
Inter-Core Communication Issues: Use debug tools to monitor shared memory and communication channels.
By following these steps, you can successfully light and debug a dual-core microcontroller.


评论
发表评论